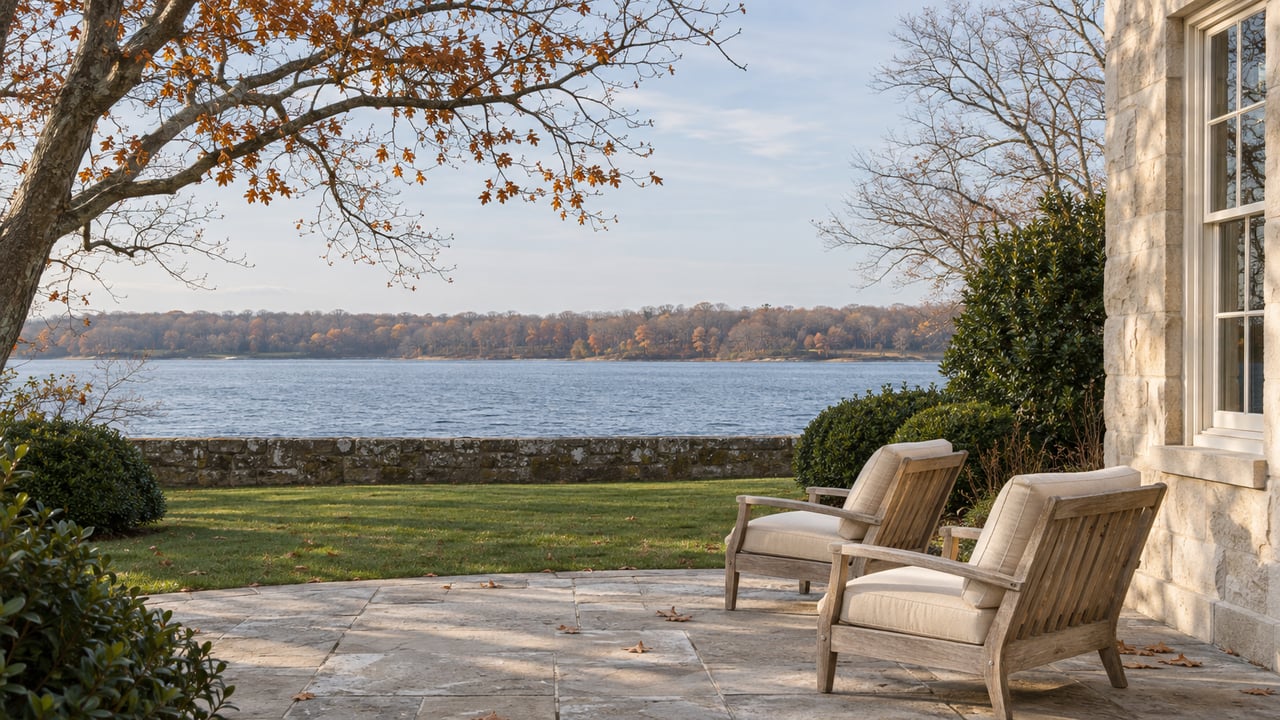
How to Read Malba Home Prices When the Median Won't Hold Still
November 19, 2026
November 19, 2026
In April 2025, 117 Malba Drive came on the market at an asking price of nearly $8 million. It is a Mediterranean-style waterfront house of 8,300 square feet, and the sale includes a deeded boat dock in the neighborhood's private marina. After several price cuts it went under contract in July at an ask just under $7 million. On August 26, 2025, it closed for $6.28 million. The Real Deal reported that this was the highest price ever recorded in Malba. The previous record was $5.5 million, paid for the same house in 2017.
That record sale closed in the third quarter of 2025. PropertyShark's Malba median for that quarter was $1,420,000.
The most expensive house ever sold in Malba did not pull the quarter's median up, because seven deals closed that quarter and a median only reports the one in the middle. When three deals close, the middle one can be almost anything. That is the first thing to understand about any Malba price you see on a portal. In a neighborhood this small, the quarterly median mostly tells you which houses sold. Price per square foot has been far steadier, and it is the better place to start.
PropertyShark's most recent quarter makes the point. In the third quarter of 2026, Malba's median sale price was $1.16 million, down 18.3% from a year earlier, on three recorded deals. In the same quarter, the median price per square foot was $753, up 6.4% year over year. Two numbers for the same three months moved in opposite directions. A buyer who saw only the first number would think Malba got cheaper this summer. The second number shows that buyers paid more for each foot of house.
The two quarters before that tell the same story from the other side. In the first quarter of 2026, Malba's $2.5 million median put it fifth on PropertyShark's list of the most expensive New York City neighborhoods. That was the highest any Queens neighborhood had ever ranked. PropertyShark tied the jump to the houses themselves. The homes sold that quarter averaged 3,096 square feet, compared with 1,351 square feet a year earlier and a Queens average of 2,025 square feet. Three months later, Malba dropped off the same list entirely. Only two deals closed in the second quarter, which was too few for the ranking to include it.
PropertyShark's figure also covers more than single-family houses. Its method counts single-family homes, condos and co-ops together and needs at least five qualifying sales for a neighborhood to make the ranking.
This is PropertyShark's Malba series from the start of 2024 through the third quarter of 2026: deals closed, median sale price and median price per square foot.
| Quarter | Deals | Median sale price | Median price per sq. ft. |
|---|---|---|---|
| Q1 2024 | 1 | $3,929,887 | $705 |
| Q2 2024 | 1 | $1,950,000 | $683 |
| Q3 2024 | 4 | $1,200,000 | $697 |
| Q4 2024 | 4 | $1,440,000 | $642 |
| Q1 2025 | 6 | $1,812,500 | $704 |
| Q2 2025 | 7 | $2,330,000 | $729 |
| Q3 2025 | 7 | $1,420,000 | $708 |
| Q4 2025 | 3 | $1,200,000 | $526 |
| Q1 2026 | 5 | $2,500,000 | $687 |
| Q2 2026 | 2 | $2,349,500 | $548 |
| Q3 2026 | 3 | $1,160,000 | $753 |
Over these eleven quarters the median ranged from $1.16 million to $3.93 million. The top of that range was a quarter with a single sale, so that "median" is just one house's price. In nine of the eleven quarters, price per square foot fell between $642 and $753. The two quarters below that band had three deals and two deals. For comparison, the Queens-wide median rose from $750,000 to $880,000 between the first quarter of 2024 and the third quarter of 2026. Malba's figures sit well above the borough's, but quarter to quarter they move around far more.
Public records show what that steadier per-foot number looks like house by house. Below are recorded Malba single-family closings from the first ten months of 2026, ordered by price. The per-foot figures are our own math, dividing each recorded price by the house's listed square footage.
The prices on this list run from $1.3 million to $3.1 million, a spread of more than double. Seven of the eight per-foot figures fall between about $590 and $760. Once size is accounted for, a 1950 house on Malba Drive and a 4,000-square-foot house on Point Crescent sold within a few dollars of each other per foot.
The one sale well above the band is 144-30 South Drive. That house has 1,409 square feet on a lot of almost 9,000 square feet. When a small house sits on a large Malba lot, much of the price is paying for the land, and a per-foot figure based on the house alone overstates it. Rebuilding on these lots has a long history in Malba. The house at 117 Malba Drive was itself the result of a full demolition filed in 2007 and a new building completed in 2008. In 2025, a new-building permit was filed for 11-23 Malba Drive, where the existing house was built in 1920 and has 1,152 square feet. The filing proposes a two-story building.
Water and dock access are the other reasons a house leaves the band, and they push in the same direction. At about $757 per foot, 117 Malba Drive's record price sits at the top of the range rather than above it, for a house with a deeded slip in the private marina. Its asking price was a different matter. The house first listed for close to $8 million and closed for $6.28 million.
The waterfront house at 3 Point Crescent has gone through the same pattern more than once. The Real Deal reported that it first listed in 2017 at $9.2 million, at the time the highest asking price in Queens. It sold for $4 million in 2022 and went under contract again in 2025 at a last ask of $5.9 million. It closed on November 4, 2025, for $5.5 million. The same report noted that Malba sellers have been trying for several years to push prices to new highs, and that closings have kept falling short of those asking prices.
Larger, newer houses on the 2026 list sold at the lower end of the per-foot range. 1-04 Malba Drive, at nearly 5,000 square feet, came in around $628 per foot, and 6 Summit Place, at 4,720 square feet, came in around $593. Past a certain size, each added square foot adds less to the price.
For a buyer comparing Malba with Whitestone, Bayside or the North Shore, the useful question is not what Malba's median is this quarter. It is where a particular house falls against roughly $590 to $760 per foot of recent Malba sales, and why. Start with the house's square footage. Then adjust for lot size relative to the house, water frontage or a marina slip, and whether the house is a 1910 or 1950 original or a post-1989 build. A seller can price from the same starting point. The two 2025 waterfront records show that a list price set well above where the per-foot band points tends to come down before closing. Buyers can find more on our buyer resources page, and owners can find more on our seller page.
What did Malba homes sell for in 2026? The closings recorded from January through October 2026 listed above ranged from $1.315 million at 13-03 Malba Drive to $3.12 million at 1-04 Malba Drive. Most fell between about $590 and $760 per square foot.
Why did Malba disappear from the most-expensive-neighborhood rankings in mid-2026? Only two deals closed in the second quarter of 2026, which was below the five-sale minimum PropertyShark uses for its ranking.
What is the highest price ever paid for a Malba home? $6.28 million, for 117 Malba Drive, on August 26, 2025.
Pricing a Malba home starts with the right comparable sales, not the latest quarterly median. When we prepare a valuation, Michelle Zhao Group measures your house against recent closings by size, lot and water access, and we present it in English or Chinese. When you are ready, request a luxury home valuation.
Stay up to date on the latest real estate trends.
We pride ourselves in providing personalized solutions that bring our clients closer to their dream properties and enhance their long-term wealth.